Position Analyzer
The Position Analyzer charts position risk across price, time, and volatility, so you can see the whole shape of a trade instead of a single profit number. It also lets you review the settled result of trades closed earlier today alongside your open positions.
Open Position Analyzer from the Bots menu, or go to /trading/bots/analyze. You can also use the Analyze Position Risk action on an open or closed trade row of your trading dashboard to open the analyzer with that trade already selected. The action is available only while the trade has at least one unexpired option leg. For a trade closed on an earlier day, that action is the way to bring it into the analyzer — the checkbox list itself only reaches back to the start of the current trading day.
Choose what to analyze
Start by picking an Underlying. The analyzer works one symbol at a time, because positions on different underlyings do not share a price axis. Once a symbol is chosen, your open positions and today's closed trades that still have unexpired option legs are listed as checkboxes, and you can narrow that list by strategy, portfolio, or account. Use Show Closed to include or hide settled trades. Tick one position to study it on its own, or tick several — including Select all — to chart them as a single combined book.
A closed trade behaves differently depending on what else is selected. Charted alongside open positions, it simply adds the profit or loss it actually realized, shifting the combined curve without adding back risk that no longer exists; its contracts stay visible in the positions table as settled zero-quantity rows. When every selected trade is closed, the surface instead rebuilds the original entered quantities and models how the position would look if it had remained open, and a dashed Realized Finish line and summary value show what the trade actually made or lost so you can compare the exit with the position you would still be holding. Both remain available only until all of the trade's option legs expire.
Read the chart
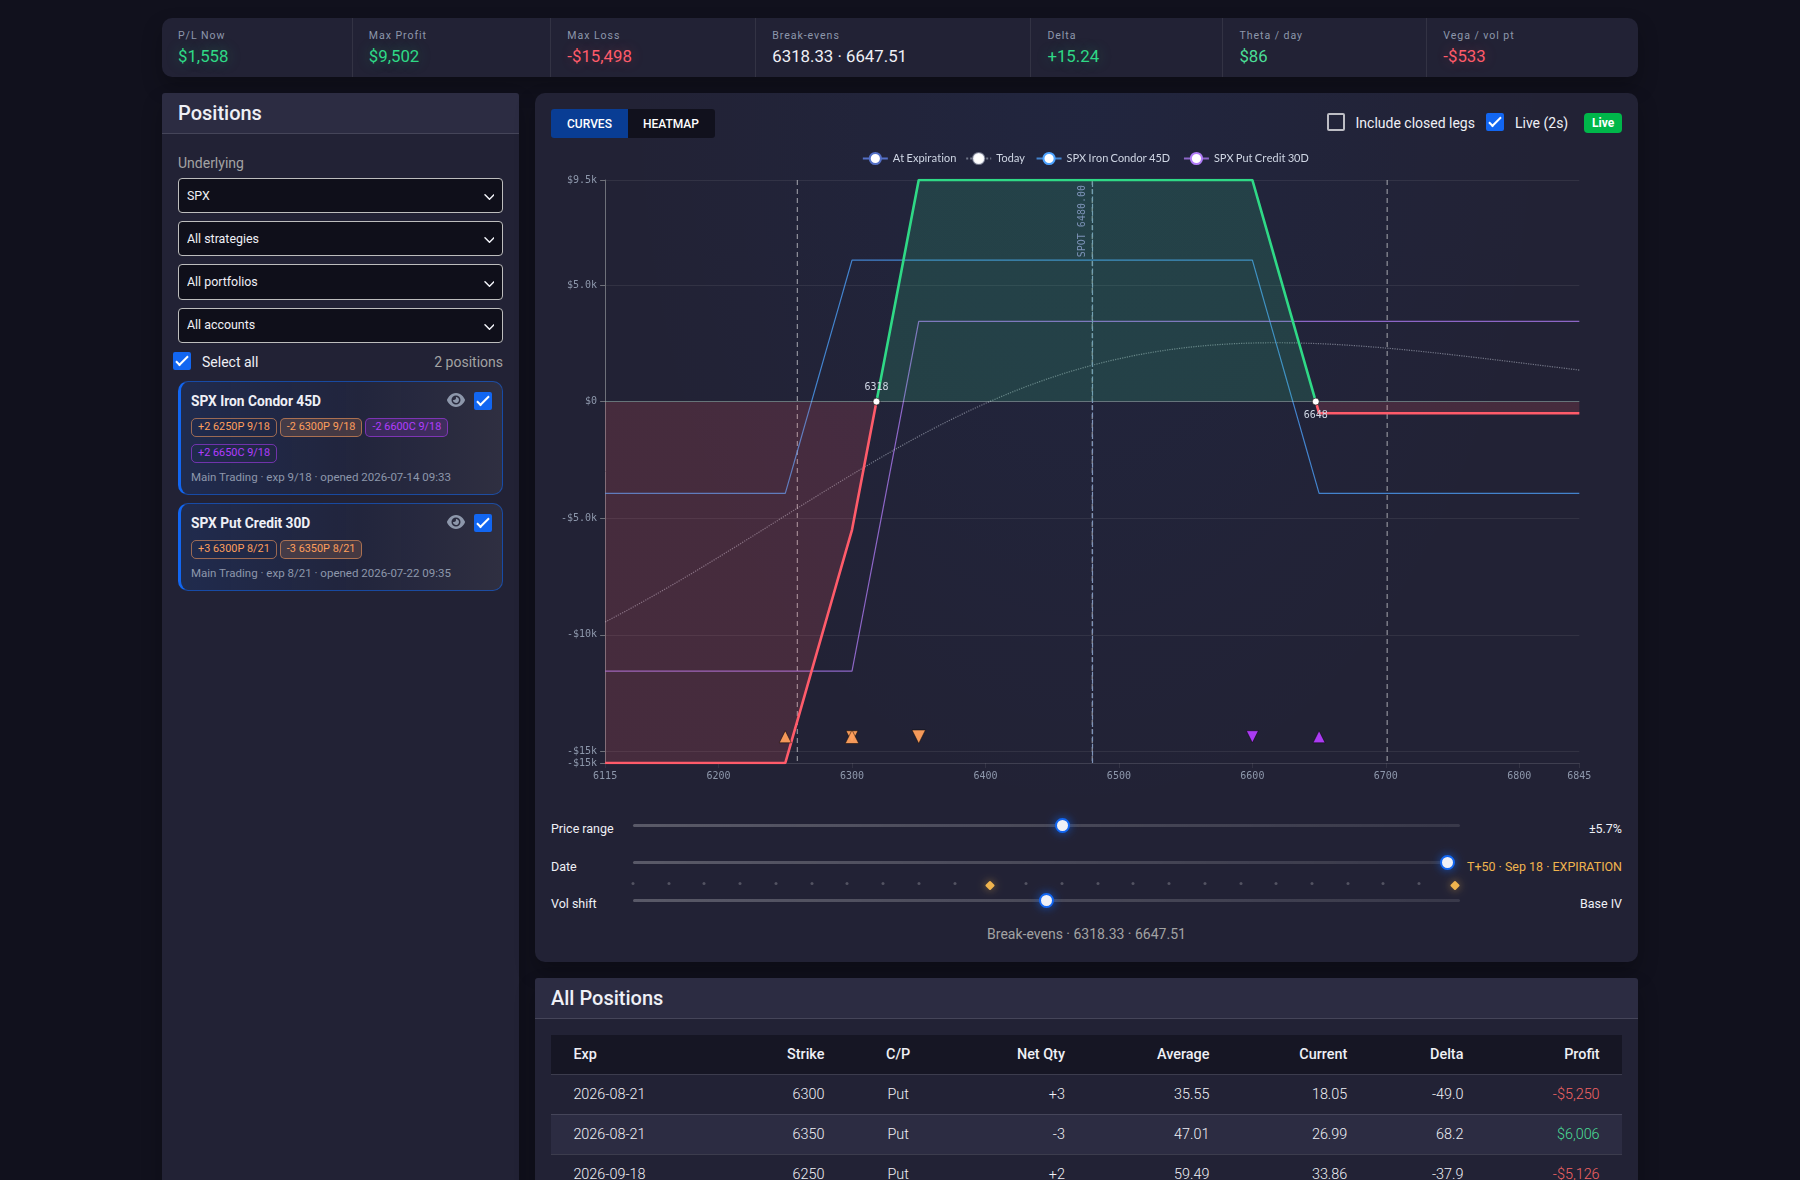
The chart plots profit and loss on the vertical axis against the underlying's price on the horizontal axis. Where the curve crosses zero is a break-even, and those prices are listed under the chart. Two views are available:
- Curves draws the profit-and-loss line for the scenario you have scrubbed to, with the at-expiration payoff for reference. This is the view for reading break-evens and the shape of your risk.
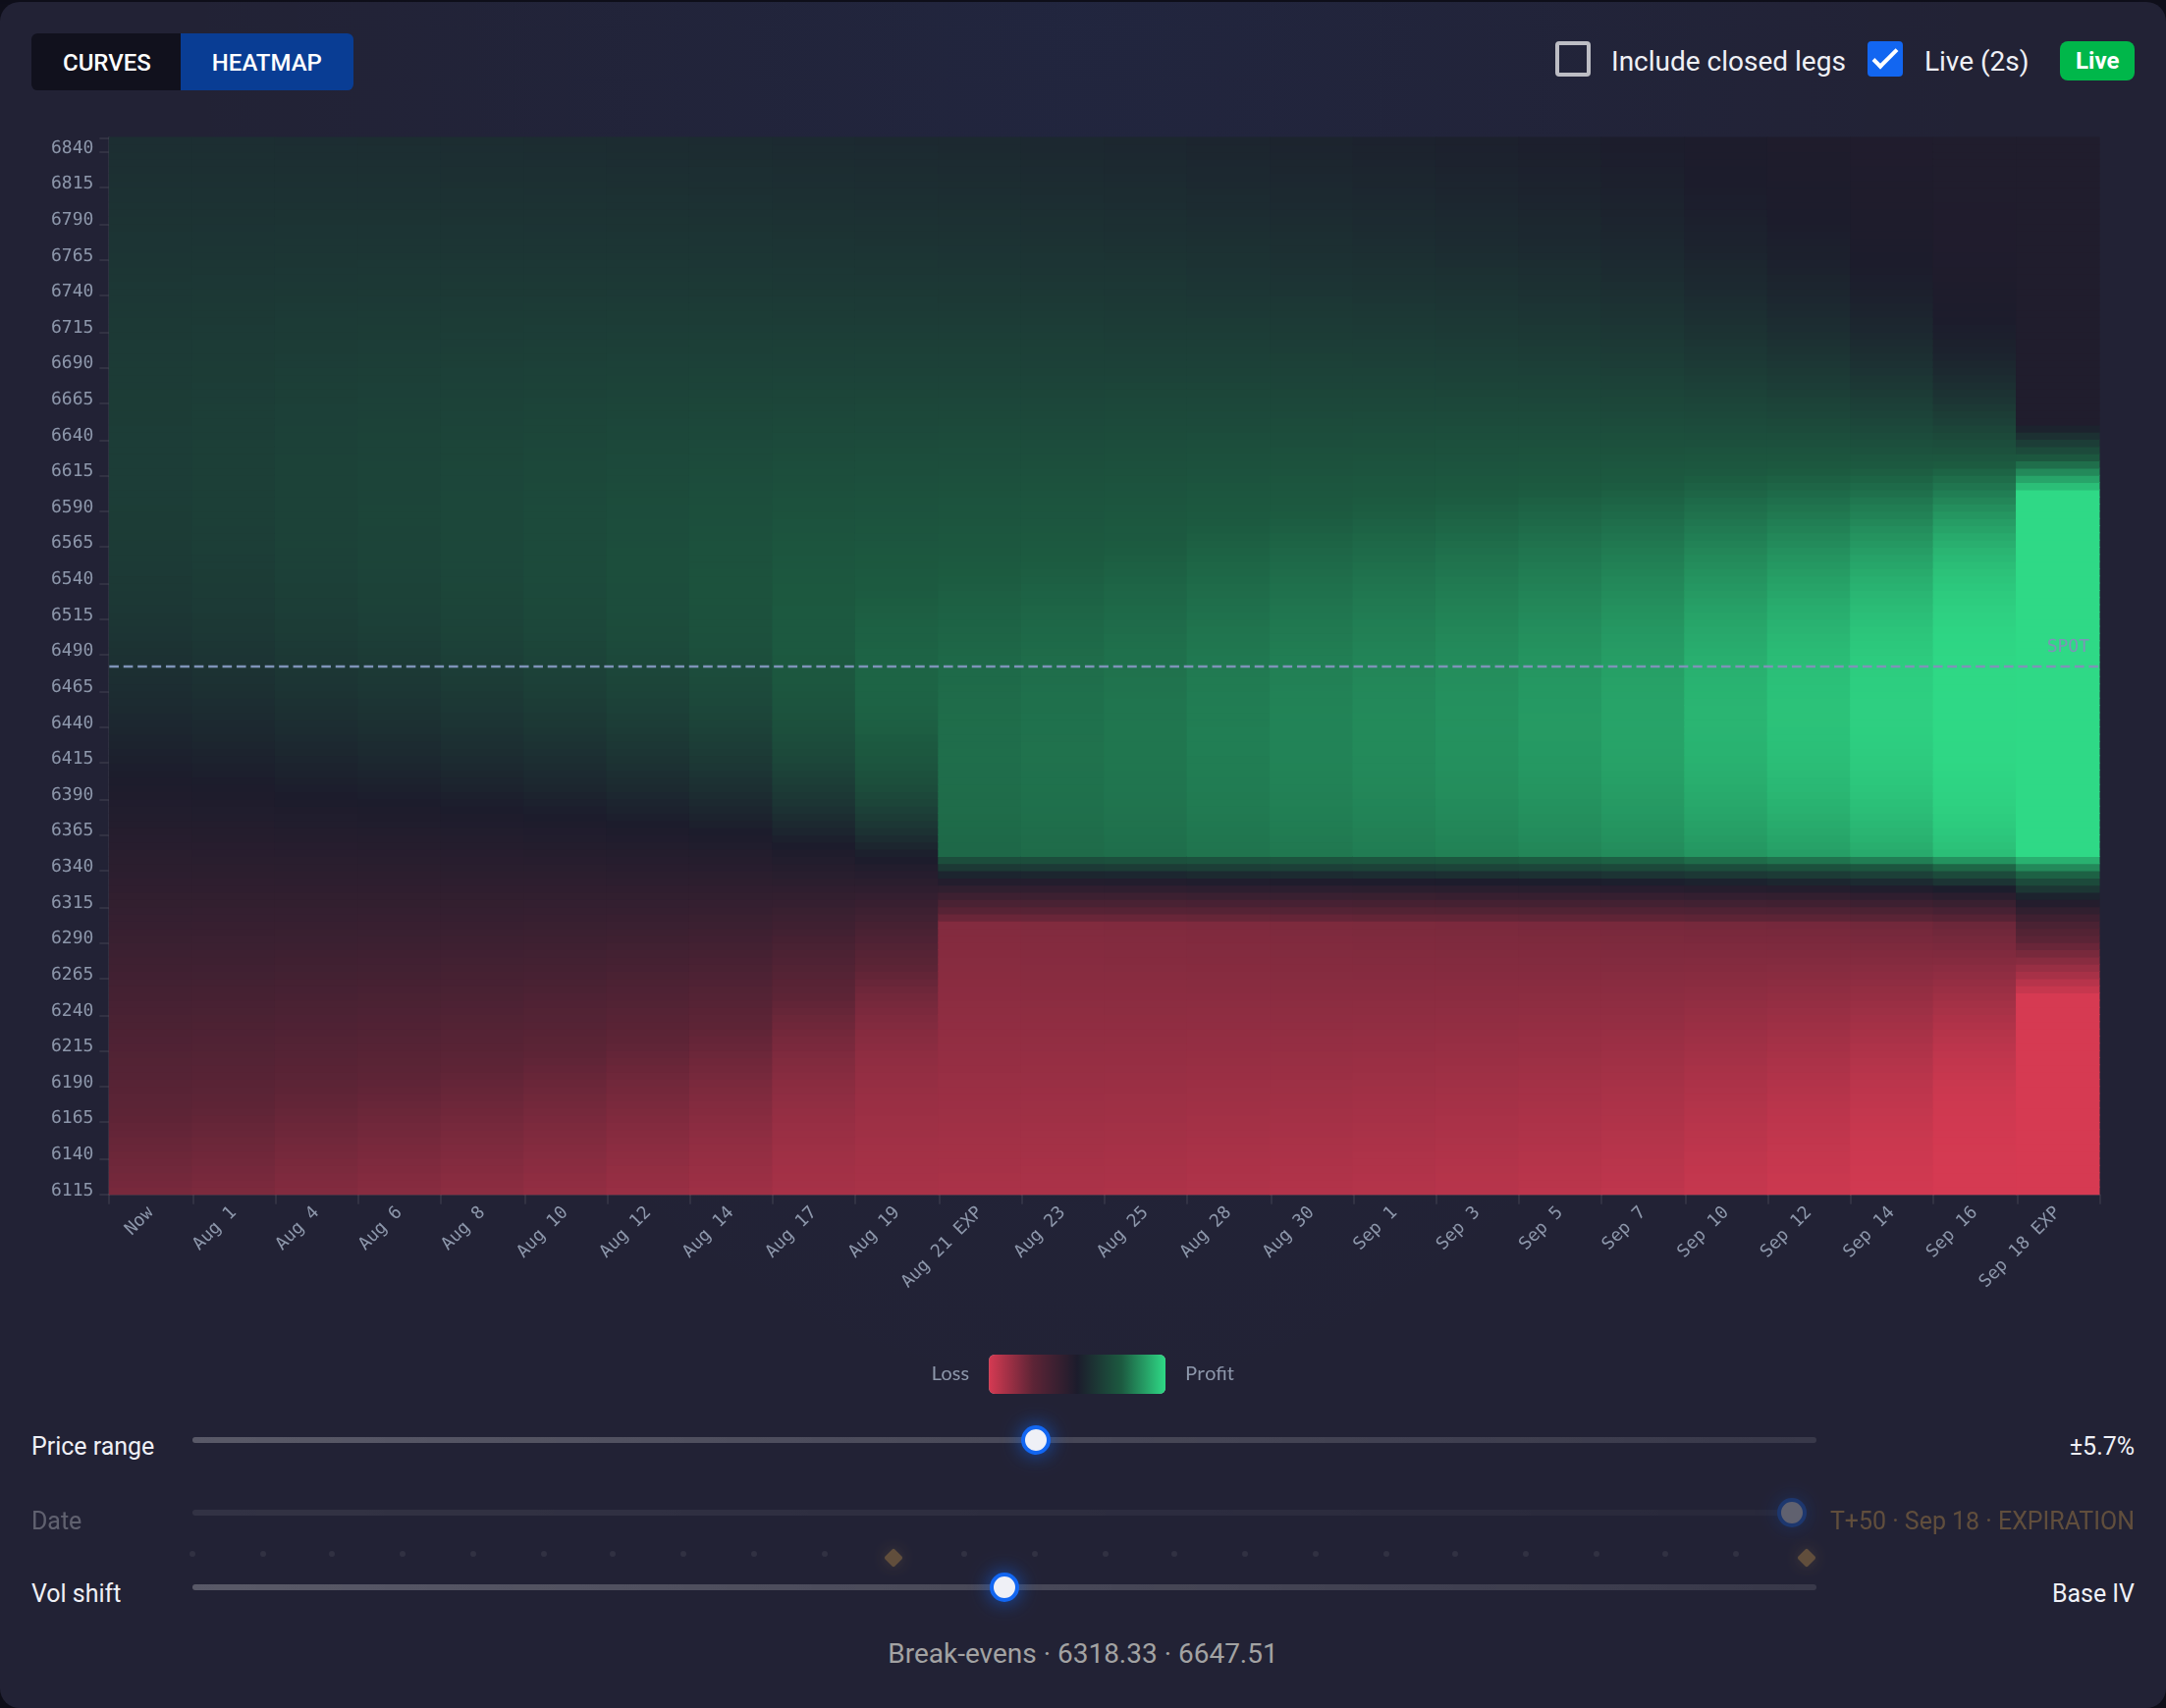
- Heatmap shows profit and loss as color across price and date at once, which makes it easier to spot where a position turns from green to red as time passes.
Move through price, time, and volatility
Three sliders sit under the chart. Moving them redraws instantly — nothing is refetched — so you can sweep through scenarios freely.
| Slider | What it changes |
|---|---|
| Price range | How far above and below the current price the chart reaches. It opens sized to your position's own strikes, so the whole structure is on screen; from there you can widen or narrow it. Scrolling over the chart does the same thing. |
| Date | The date the profit and loss is calculated for, from now through each expiration in the selection. Dragging to an expiration shows the settled payoff on that date. |
| Vol shift | A change in implied volatility applied across the position. Step sizes are scaled to the underlying's own volatility, so one notch means a comparable move whether you are trading a quiet index or a volatile single name. |
Summary tiles
Above the chart, the summary tiles describe the selection at the scenario you are currently viewing:
| Tile | What it shows |
|---|---|
| P/L Now | Profit or loss on the selection at the current price. |
| Realized Finish | For a closed-trade comparison, the actual final profit or loss. P/L Now is relabeled If Still Open beside it. |
| Max Profit / Max Loss | The best and worst outcomes within the charted price range. Widen the price range if a position's true worst case sits outside the window. |
| Delta | How much the selection gains or loses for a one-point move in the underlying. |
| Theta / day | How much time decay adds or costs per day. |
| Vega / vol pt | How much a one-point change in implied volatility is worth to the selection. |
For a book of several positions, Greeks by Trade below the chart breaks the same figures out per position, so you can see which bot is carrying the exposure.
All Positions and Price Slices
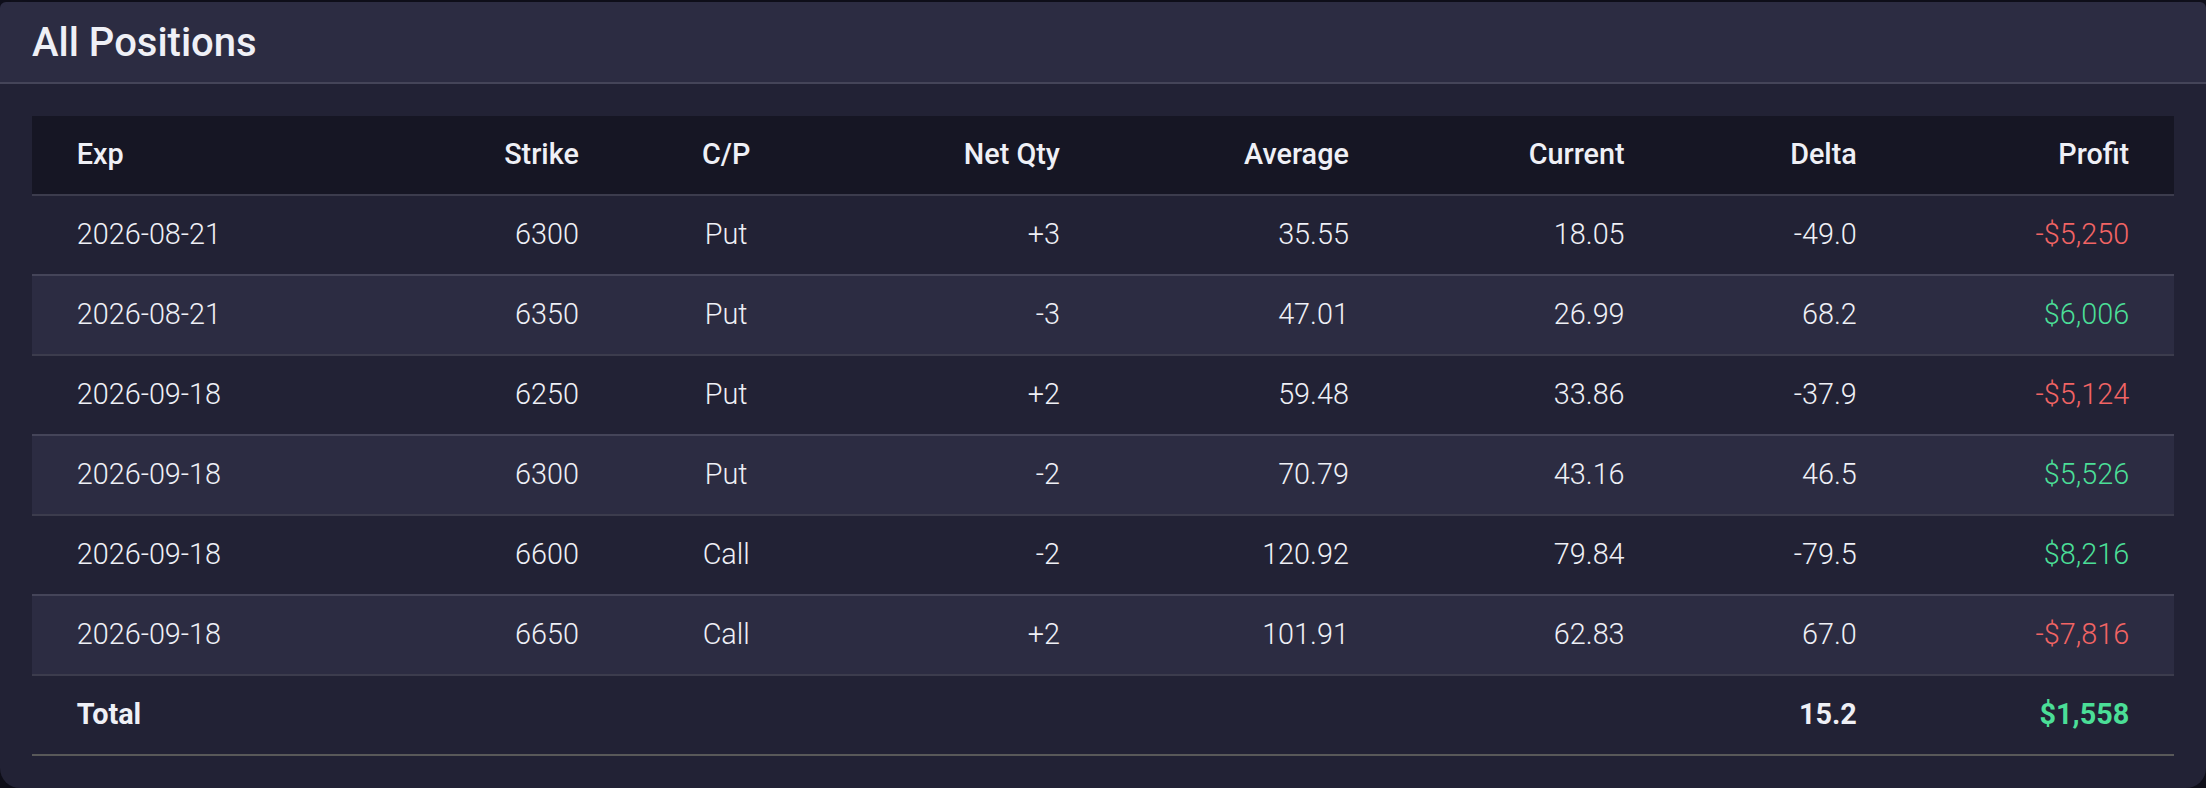
All Positions lists every contract in the selection, merged so a strike held by several bots appears once with its net quantity. It shows the average price your bots opened at, the current mark, that contract's delta, and its profit. Closed legs in a trade that is still running stay in the table at zero quantity, greyed out, carrying the money you actually realized on them rather than disappearing. For a fully closed trade, the table instead shows the original entered quantities used by the comparison model. When a contract has no quote available, its Current and Profit cells read — rather than a made-up number.
Price Slices answers "what if the underlying is here" for specific prices. Three slices are set up for you around the current price; edit a price or a percentage move, add more with Add slice, or remove ones you do not need. Each row shows the profit or loss at the date you have scrubbed to and at expiration. Your slices are remembered per underlying.
Live updates and closed legs
Two checkboxes sit above the chart:
- Live (2s) keeps the chart following the market, refreshing quotes every couple of seconds. The badge beside it reads Live while data is fresh and counts up how long ago the last update was if it goes stale. A closed-trade comparison loads current marks once and then pauses Live automatically; turn it back on if you want its hypothetical still-open position to keep following the market.
- Include closed legs folds money already realized on closed legs into the curve of a trade that is still running, so the chart shows the trade's total result rather than only what the surviving legs can still make. A fully closed trade keeps its realized finish separate as the comparison line.
What the analyzer is and is not
Every curve is a model, priced with Black-Scholes from the implied volatility of your positions' current quotes. It is a good read on the shape of your risk and on how that shape changes with time and volatility — not a promise about fills. Real exits happen at real bid-ask spreads, and a wide market moves the number you actually get.
Where to go next
To see how directional your whole book is across every underlying at once, use Bot Portfolio Net Delta. To review what your bots did and when, see Monitor Bot Activity and Open Positions. To change the positions themselves, see Manage Your Bots.