Backtick Results: Deep-Dive Analytics
- Beyond the headline numbers
- Consistency: the Monthly Matrix and Daily Statistics
- Drawdowns and Streaks
- Entry timing: Profits by Entry Day and Entry Time
- Results on Event Days
- Market context: Underlying Change and VIX analysis
- Statistical Diagnostics: how much to trust the numbers
- Fill Quality and Slippage Potential
- SweepTick runs: the iteration views
- Focusing the workup on one position
- Actions and housekeeping on the results page
Past the headline numbers, the Backtick results page carries a full analytical workup: risk breakdowns, entry timing analysis, market context, statistical confidence checks, and fill quality. This reference explains what each section tells you.
Beyond the headline numbers
The Performance Metrics grid extends the summary covered in Read Your Backtick Results with several measures worth knowing:
| Metric | What it tells you |
|---|---|
| Total Return | Total profit expressed as a percentage of the balance the test started from. |
| Sortino | Like Sharpe, but only downside volatility counts against you. A Sortino well above the Sharpe means most of the variance was upside. |
| MAR | CAGR divided by the worst drawdown percentage. A MAR of 2 means the strategy earns about twice its worst drawdown per year. |
| Ulcer | A drawdown-depth-and-duration index: the deeper and longer the underwater stretches, the higher the number. |
| Max DD (Days) | How long the worst drawdown lasted, which is often more painful than how deep it went. |
| Avg $/Qty | Average profit per single contract of quantity, useful for comparing runs that traded different sizes. |
| PCR | Premium capture ratio: how much of the collected premium the strategy actually kept. |
| Contracts and Fees | Total contracts traded and the commissions your profile charged for them. |
Consistency: the Monthly Matrix and Daily Statistics
The Monthly Matrix lays out profit month by month with yearly totals, the fastest way to spot seasonality and long flat stretches. For tests holding multi-day trades, a toggle switches the matrix between booking each trade on its Close Date or its Open Date. Daily Statistics condenses the day-to-day experience into Avg Day, Avg Win, Max Win, Avg Loss, and Max Loss, and the Best Trading Days and Worst Trading Days tables show the specific outlier dates. If a handful of best days carries the whole result, the strategy is more fragile than its totals suggest.
Drawdowns and Streaks
The drawdown analysis charts how far and how long the equity curve sat below its high-water mark, and Top 5 Worst Drawdowns lists the five deepest episodes with their peak, low, and end dates, day counts, and dollar and percent depth. A drawdown that never recovered by the end of the test is flagged as not recovered. Streaks shows the longest winning and losing runs with their dates and combined profit, a preview of the discipline the strategy will demand from you.
Entry timing: Profits by Entry Day and Entry Time
Profits by Entry Day and Profits by Entry Time break results down by the weekday and the time of day trades were opened, each viewable as a Chart or a Statistics table. They answer questions like whether Friday entries paid for the rest of the week, or whether the edge lives only in the first entry window of the morning.
Results on Event Days
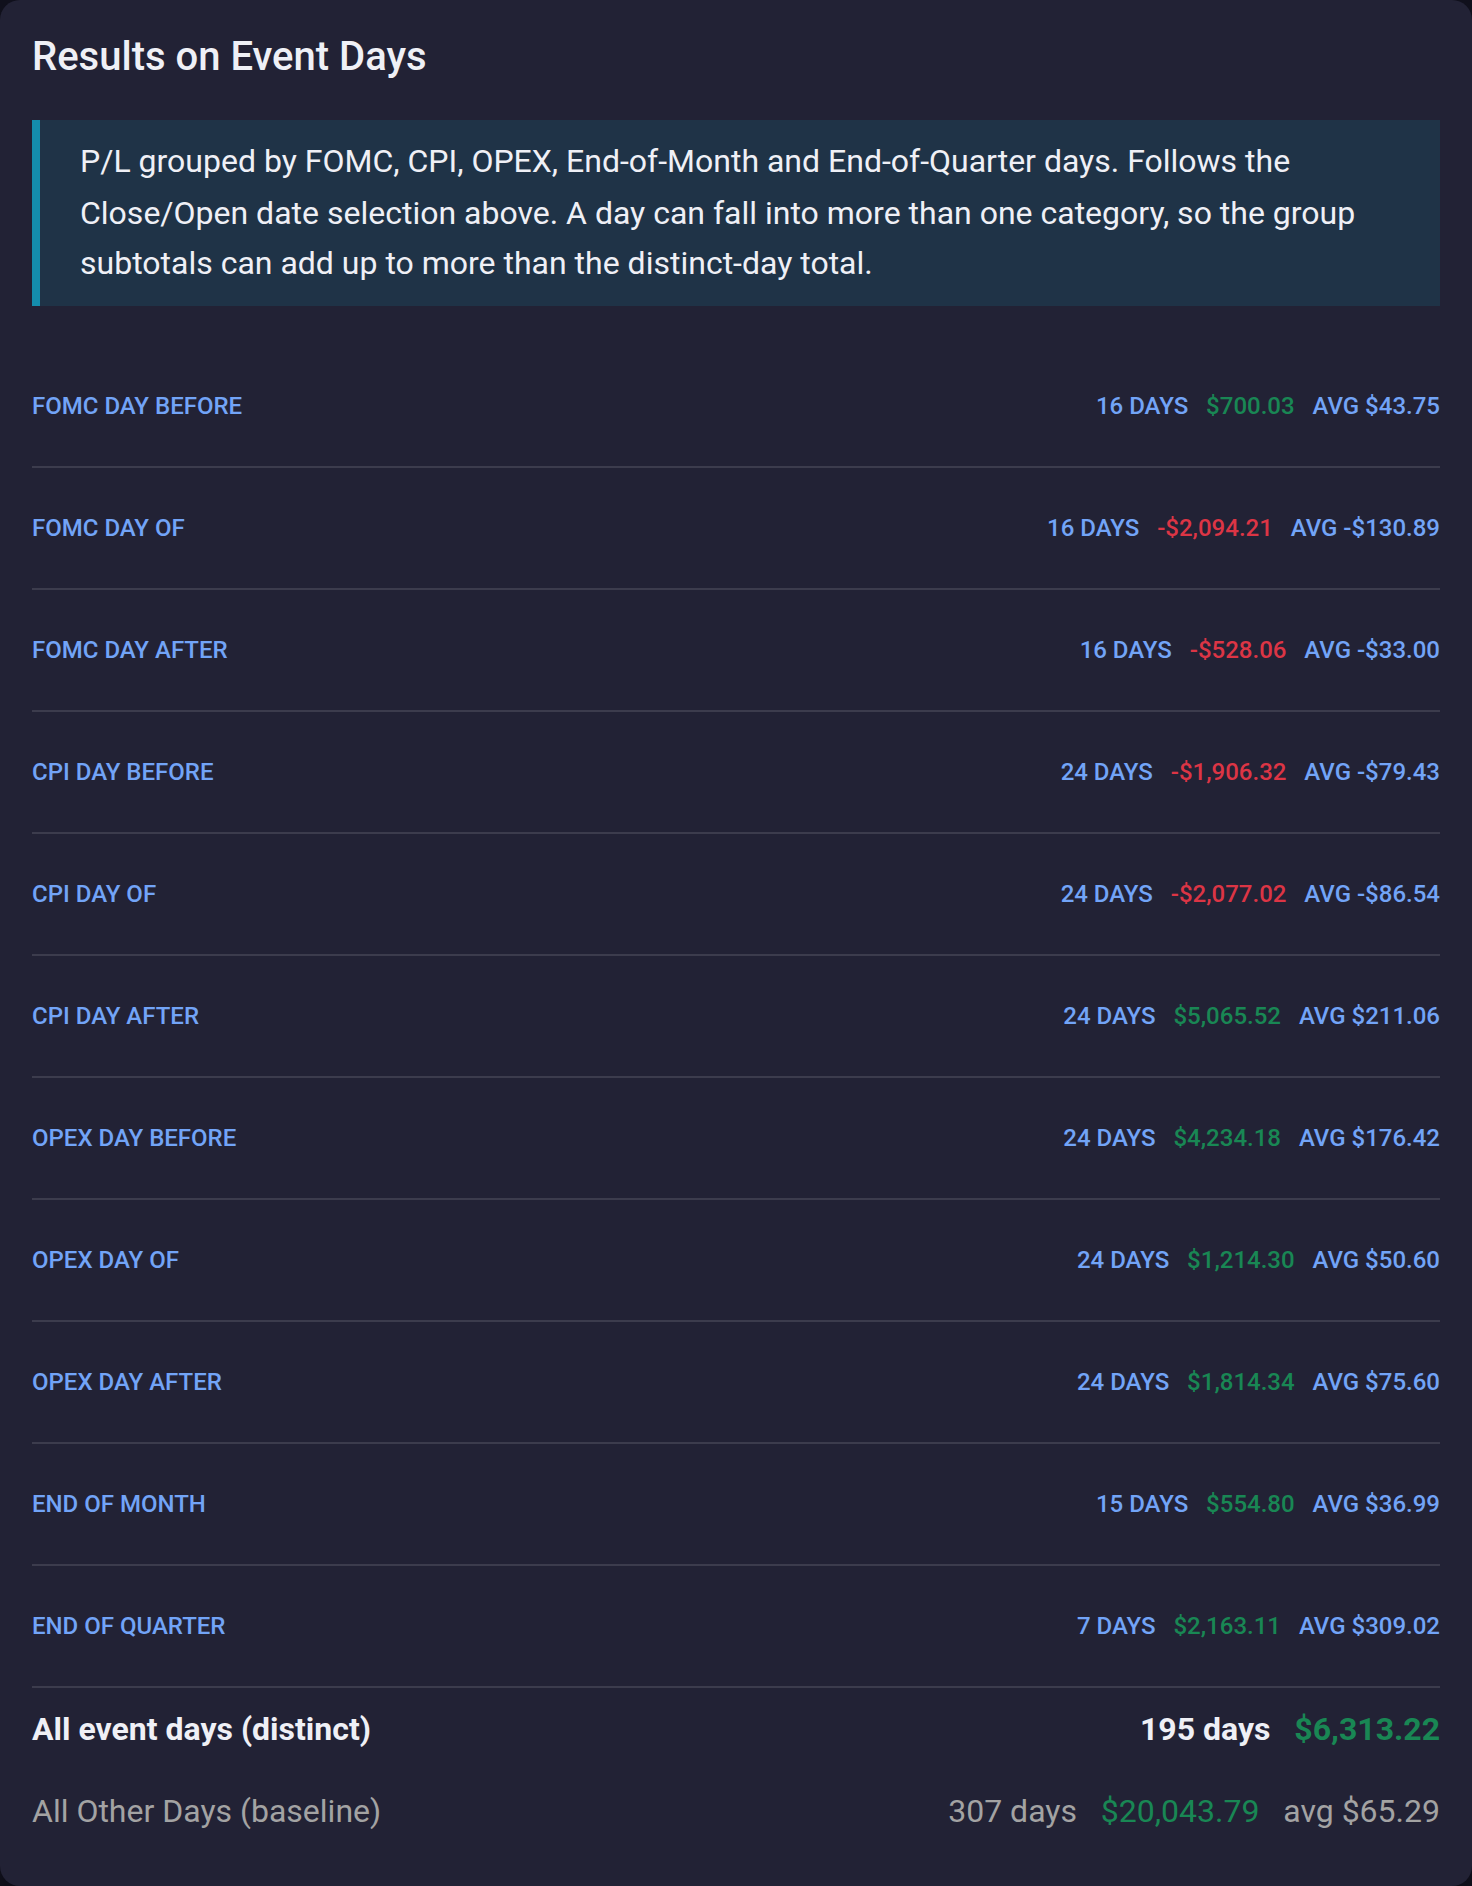
Results on Event Days regroups the same daily results by the market calendar rather than the trading calendar, so you can see what the scheduled-event sessions actually contributed. The categories are:
- FOMC, CPI, OPEX, NFP (the monthly jobs report), and GDP, each split into Day Before, Day Of, and Day After.
- First Trading Day of Month and End of Month: the first and last trading sessions of a month.
- End of Quarter: the last trading day of a quarter.
- Early Close Day: a shortened session, usually around a holiday.
That is nineteen categories, which is a lot of bars to read at once, so the panel offers two cuts of the same data. Split by day gives every category its own bar, the view to use when you suspect the day before an event behaves differently from the day of it. Group by event folds each Day Before, Day Of, and Day After into a single bar per event, leaving ten, which is the faster read when you only want to know whether FOMC weeks are worth trading at all. Grouping applies to the Range Bars and Distribution charts and to the Statistics tables.
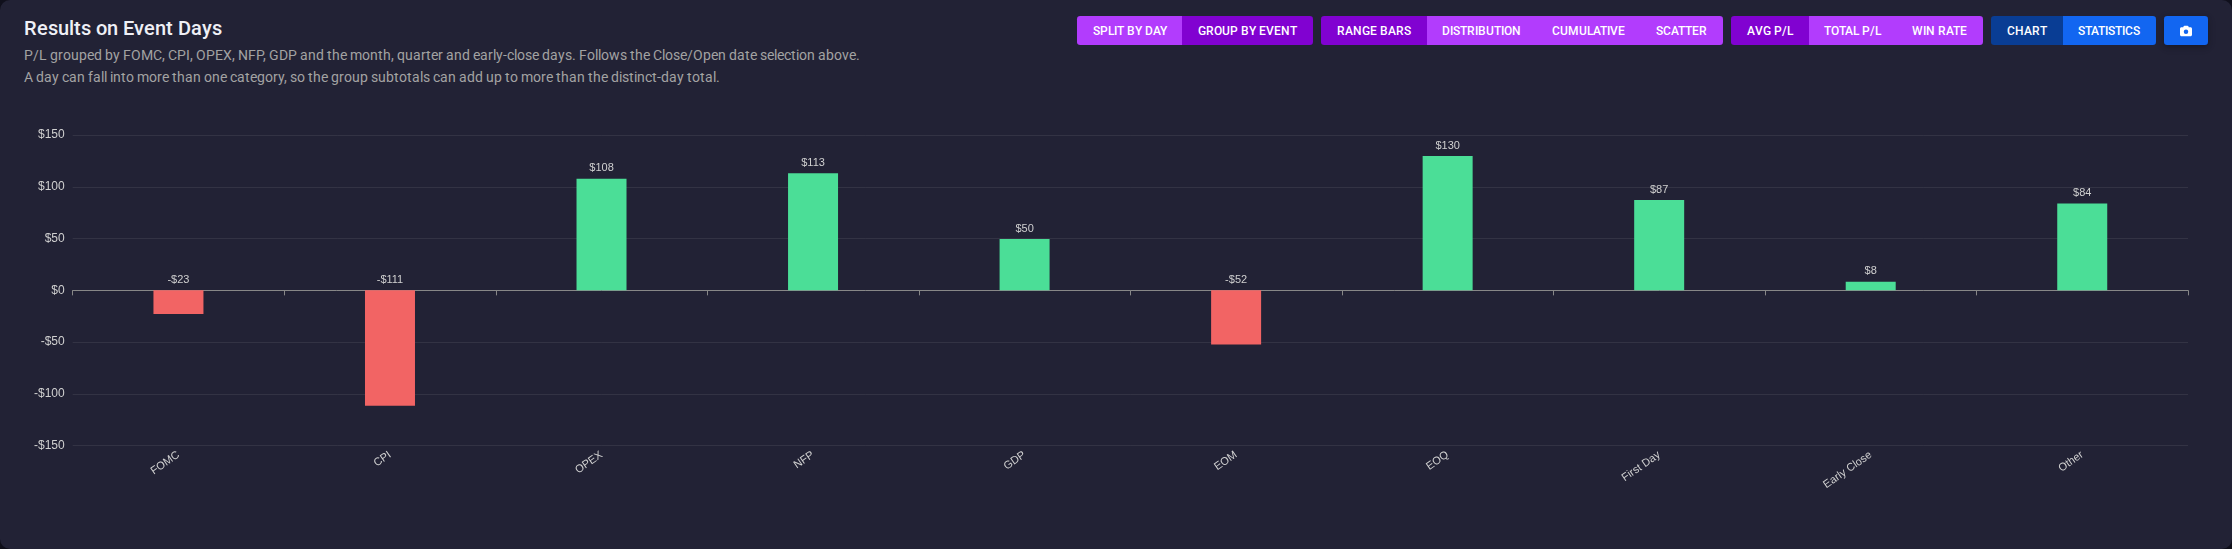
The Chart view draws the categories four ways. Range Bars plots one bar per category, switchable between Avg P/L, Total P/L, and Win Rate. Distribution replaces each bar with a box plot of that category’s individual days, which shows whether an average rests on a tight cluster or on one outlier. Cumulative draws event days and all other days as two equity curves over the same dates, so you can compare the slopes directly. Scatter plots each event day as a point, green above the line and red below.
The Statistics view swaps the chart for a tile per category carrying its day count, total, average day, win rate, average win, and average loss. Two tiles sit at the end of that grid: All Event Days totals every day that fell on at least one event, counting a date once even when it carries several, and All Other Days totals everything else. Because one date can belong to several categories, the category subtotals can add up to more than that distinct total, so judge a category against the baseline average day rather than against the other subtotals.
On tests holding multi-day trades the panel follows the same Close Date and Open Date selection as the Monthly Matrix, which separates opening into an event from holding through one.
FOMC, CPI, OPEX, NFP, and GDP dates come from published schedules that run only so far ahead, and the First Trading Day and Early Close lists are shipped calendars with the same finite horizon. If a test extends past the end of the published schedule, the panel says so beneath the chart and counts those later dates with All Other Days. The full calendar, market holidays included, is at Event Days and Market Holidays.
Market context: Underlying Change and VIX analysis
When the test data supports it, Underlying Change Analysis groups trades by how the underlying moved, and VIX & Volatility Analysis groups them by the volatility backdrop, including the VIX Open level and the VIX Change on entry days, with the VIX entry range present in your data shown for reference. Together they reveal regime dependence: a strategy that only earns when VIX is quiet is a different bet from one that holds up across the range.
Statistical Diagnostics: how much to trust the numbers
Statistical Diagnostics asks whether the results are statistically meaningful or could plausibly be luck. It reports Per-Trade Sharpe and Per-Trade Sortino with confidence intervals estimated by resampling the trade list, and a Sampled MAR whose interval comes from re-running the equity curve on those resamples. It also restates Win Rate and Profit Factor with guidance on reading them together. A wide confidence interval is the page telling you the sample is too small to lean on. A per-position breakdown is available in the Statistical Diagnostics Per-Position Detail view.

Fill Quality and Slippage Potential
Slippage Potential estimates how much room the simulated fills leave for real-world slippage, based on the quoted spreads the test traded through. The Fill Quality Per-Position Detail view breaks it down by position and leg count, showing the average spread cost alongside the 90th, 95th, and 99th percentile and maximum cases. If the tail percentiles are large relative to the average trade profit, live results will be noticeably more sensitive to execution than the backtest suggests.
SweepTick runs: the iteration views
When the run is a SweepTick sweep, the results page swaps the single-strategy summary for iteration analytics that compare every generated variation, several of them versus the sweep's baseline position:
- SweepTick Best by Metric: tiles naming the winning iteration for each metric. On single-setting sweeps a Refine Around Winner action sweeps a tighter range around the winner.
- Metric Sensitivity Grid: at-a-glance minis showing how each metric responds across the swept range. A broad plateau beats a single spike. On a two-setting SweepGrid this becomes SweepGrid Metric Heatmaps, mini-heatmaps of the grid per metric that feed the full-size SweepGrid Heatmap with the best cell outlined.
- Performance by Iteration: one chart of the chosen metric (Total P/L, CAGR, Sharpe, Sortino, MAR, Win Rate, or Max DD) across the swept values. On a SweepGrid, slice controls pick which setting the chart walks while the other is held at a slider-chosen value.
- Iteration Drawdowns and Iteration Performance Statistics: per-iteration drawdown and stat tables, sortable by Total Returns, Win Rate, MAR, or Sharpe.
- Returns by Year, Exit Reason Mix, Risk vs Return, and Win Rate vs Payoff: consistency, exit composition, and scatter views for weighing iterations against each other and the baseline.
The sweep view replaces the standard single-run sections described above. Two escape hatches connect the two worlds: the Switch to Backtick Results View button re-renders the same run as a standard results page (and Switch to SweepTick Results View brings you back), and opening any single iteration from the tables gives you the full standard workup for just that position. How to set up a sweep, and why to distrust its single best result, is covered in SweepTick Parameter Sweeps.
Focusing the workup on one position
Every section above describes the Backtick as a whole. To run the same workup on a single position of a multi-position test, open it focused from the Position Performance Statistics table using the position's Results action. The page reloads scoped to that position: the summary metrics, Monthly Matrix, drawdown forensics, Best and Worst Trading Days, Streaks, Statistical Diagnostics, and Fill Quality all recompute for the focused position alone, and the main chart headings switch to Position Performance and Position Drawdown to make the scope unmistakable. The Copy and Sync Bot actions are scoped to the focused position as well, which makes the focused page the natural jumping-off point for spinning one strong position out on its own; see Copy, Rerun, and Import Backticks and Turn a Winning Backtick into a Live Bot.
Actions and housekeeping on the results page
Beyond creating bots, the results page can act on the run directly: Create Portfolio starts a portfolio from the run's positions in the Portfolio Builder, Create New Strategy sets up a strategy group for the bots you are about to create, Manage Tags organizes the run, and the Notes card keeps your written context attached to the result. A compact dashboard layout of the same headline numbers, including the starting balance the test grew from, is used for at-a-glance and shared views.