Stop Outcomes Report
Stop Outcomes shows what happened to your trades after a stop first hit: which ones closed at the stop, which ones cleared and kept running, and whether a second stop saved money or cost more than closing at the first one.
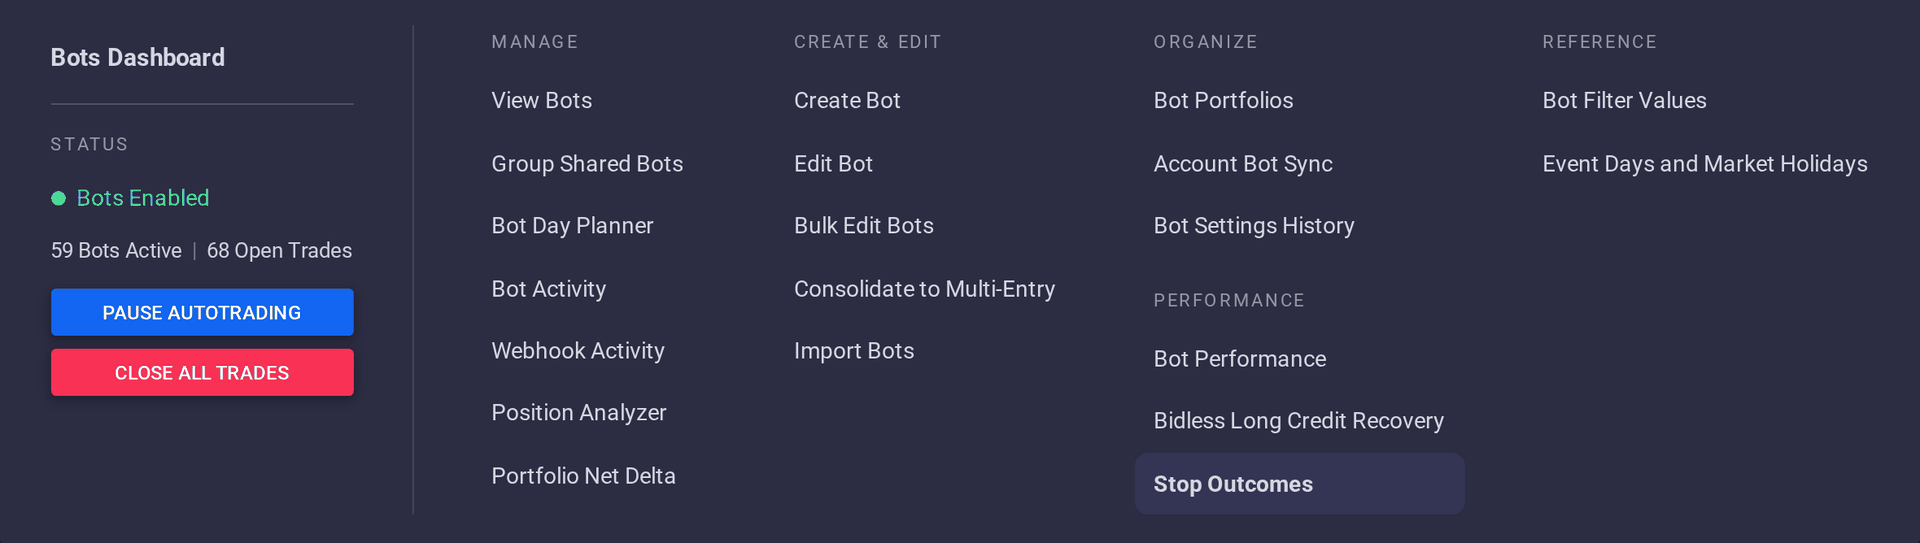
Open Stop Outcomes
From the Bots menu, choose Stop Outcomes under Performance, or go to /trading/bots/stop-outcomes. There is also a Stop Outcomes button next to Show Me The Stats on Bot Performance.
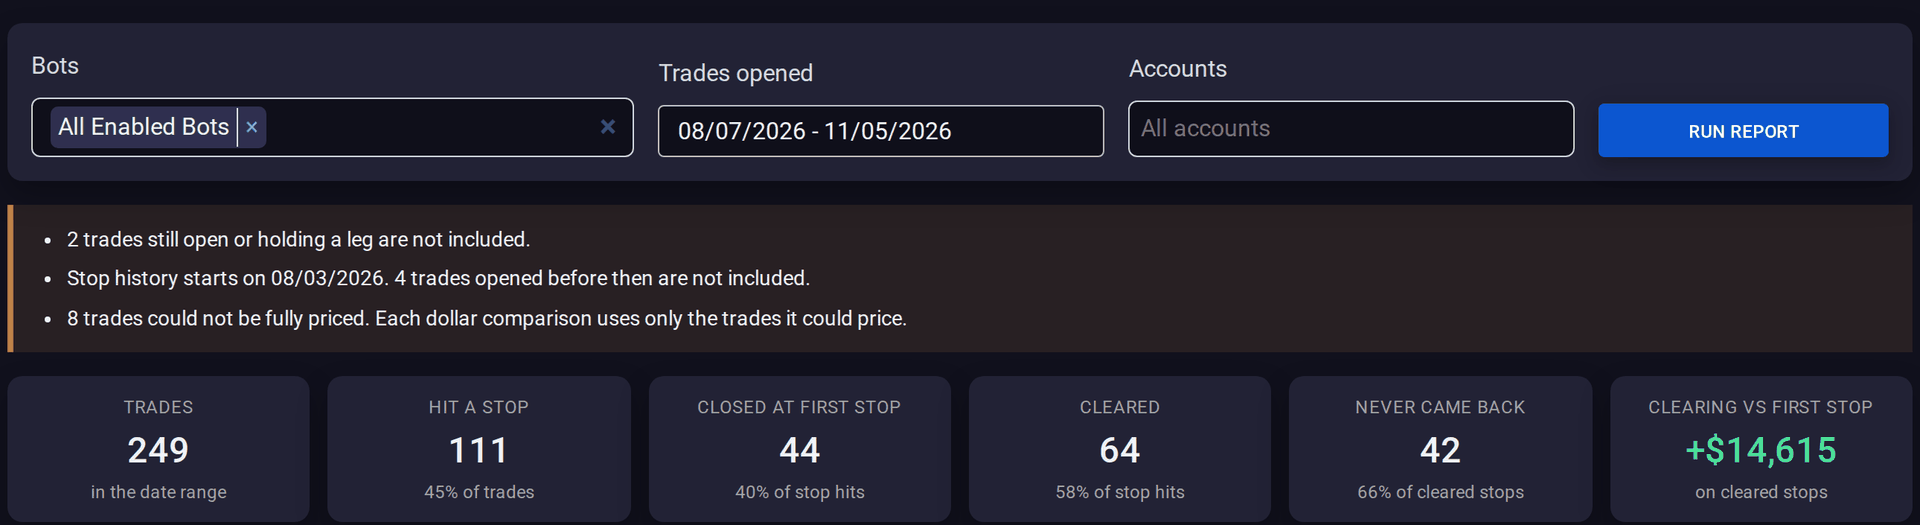
Choose what to report on
- Bots: All Enabled Bots is selected to start. Choose All Bots to include disabled and archived bots too, or pick individual bots from the Enabled, Disabled, and Archived lists.
- Trades opened: the date range, up to 365 days. It opens on the last 90 days. A trade counts in the range it was opened.
- Accounts: leave it empty to include every account, or pick specific ones. Accounts that are turned off or closed at the broker are listed under Inactive.
Choose Run Report to build the report.
How a stop plays out
The report follows each trade from its first stop hit. A stop hit is the first check that finds the trade past its stop. What happens next depends on the stop:
- Closed at first stop: the stop closed the trade.
- Cleared: a Bot Algo stop checks again before it closes (see Stop speed). If those checks no longer find the trade past its stop, the stop clears and the bot goes back to normal monitoring without closing the trade.
- Ended during the check: the trade exited, hit a time exit, or the check stopped before the stop either closed the trade or cleared.
A cleared trade then goes one of two ways. Never came back means that stop did not close the trade later. Came back to the stop means the same stop hit again and closed the trade. For those trades the report asks whether the second stop closed the spread for less than closing at the first stop would have cost (Second stop saved money) or for more (Second stop cost more).
Read the totals
Above the results the report lists what it left out: trades still open or holding a leg, trades opened before stop history starts (the date is shown), and trades that could not be fully priced. Below that are six totals:
- Trades in the date range, and how many Hit a stop.
- Closed at first stop, Cleared, and Never came back, each with its share of the trades before it.
- Clearing vs first stop: how many dollars better or worse the bot finished on cleared stops than closing at the first stop would have. A positive number means clearing helped.
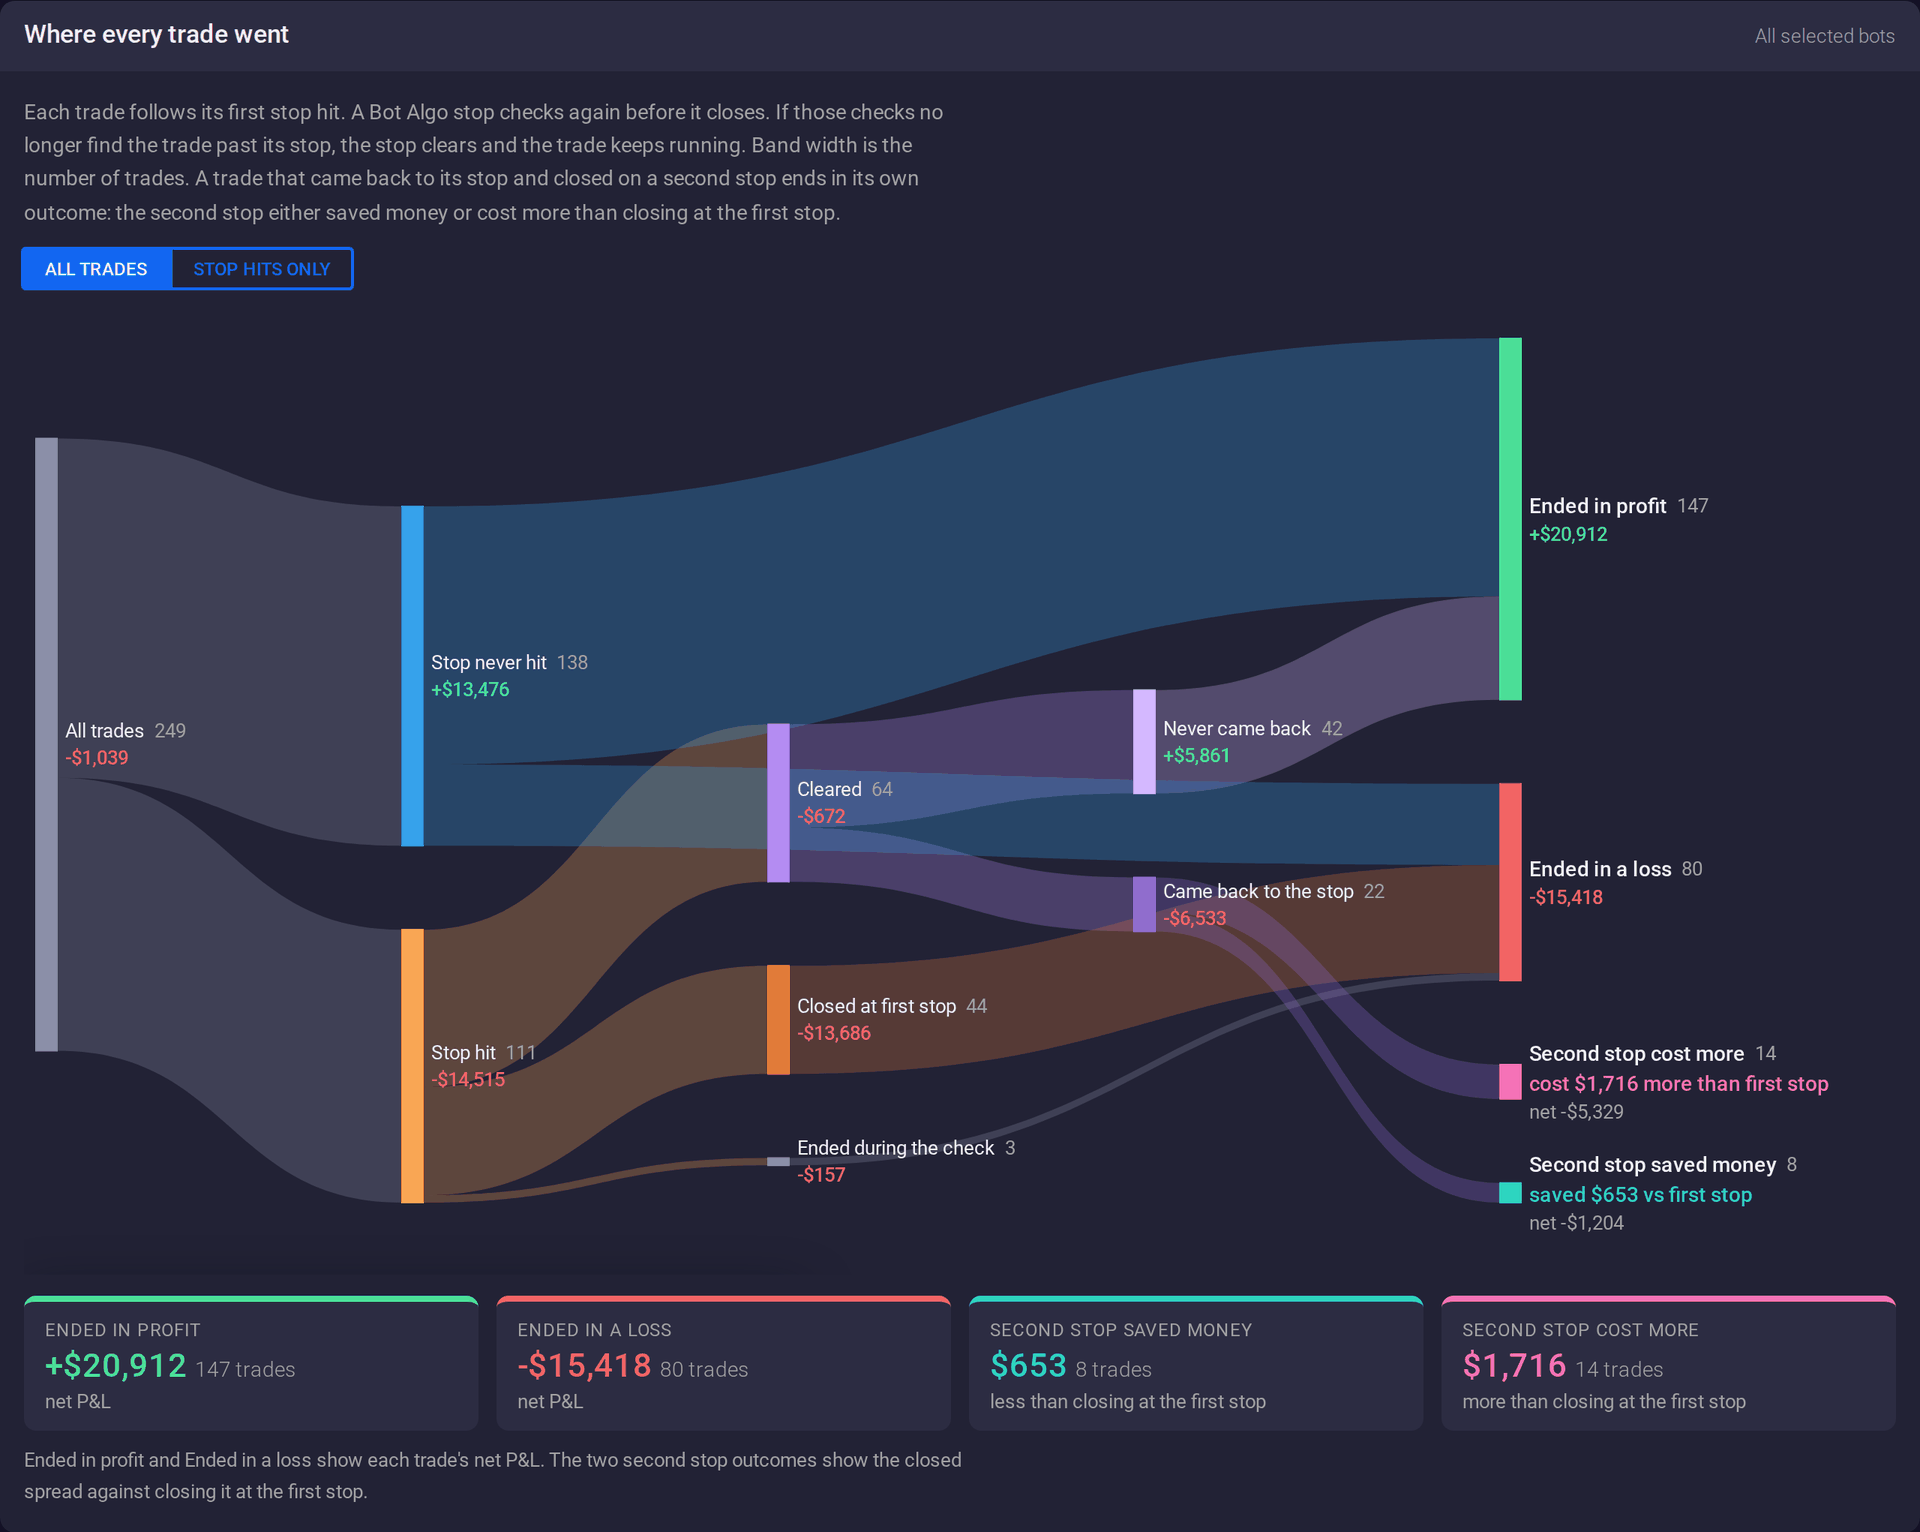
Where every trade went
The diagram shows each trade's path from left to right. Band width is the number of trades, and each box shows its trade count and net P&L. Trades end in one of four outcomes. Ended in profit and Ended in a loss use each whole trade's net P&L after fees, the same figure as the Bot Performance trade log, and a trade that breaks even counts as a loss. Second stop saved money and Second stop cost more show the closed spread against closing it at the first stop.
Choose Stop hits only above the diagram to leave out trades whose stop was never hit. The four tiles under the diagram total the four outcomes.
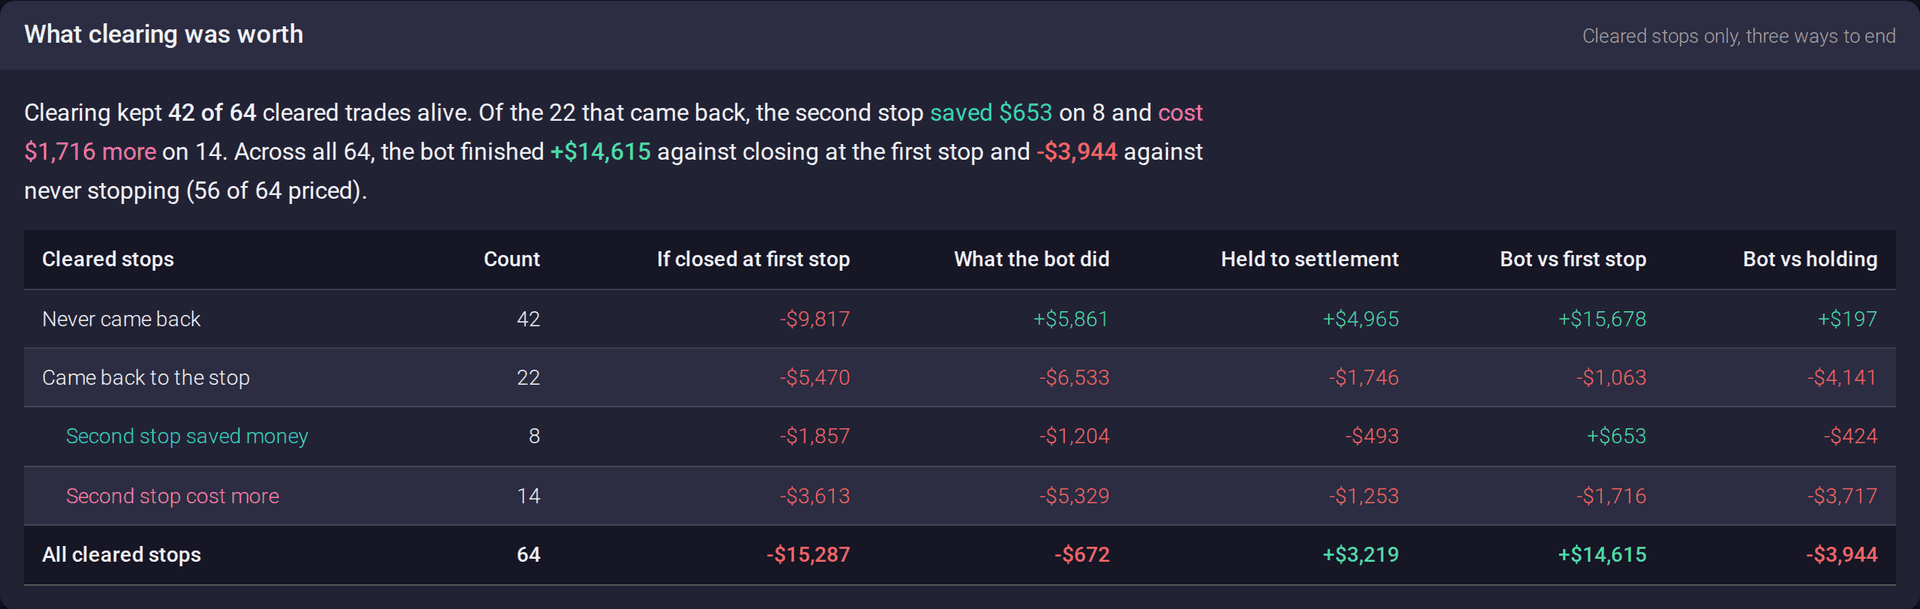
What clearing was worth
For cleared stops only, this table compares three ways each trade could have ended: If closed at first stop, What the bot did, and Held to settlement. Bot vs first stop and Bot vs holding show the difference between what the bot did and each of the other two. A sentence above the table sums it up in plain words.
If closed at first stop prices the stopped spread at its mark when the stop was first hit, so it leaves out slippage. Held to settlement prices every stopped leg at its value at expiration, using the underlying's closing price on expiration day, the same close the bot uses for expired legs. A dash means none of those trades could be priced.
Compare bots
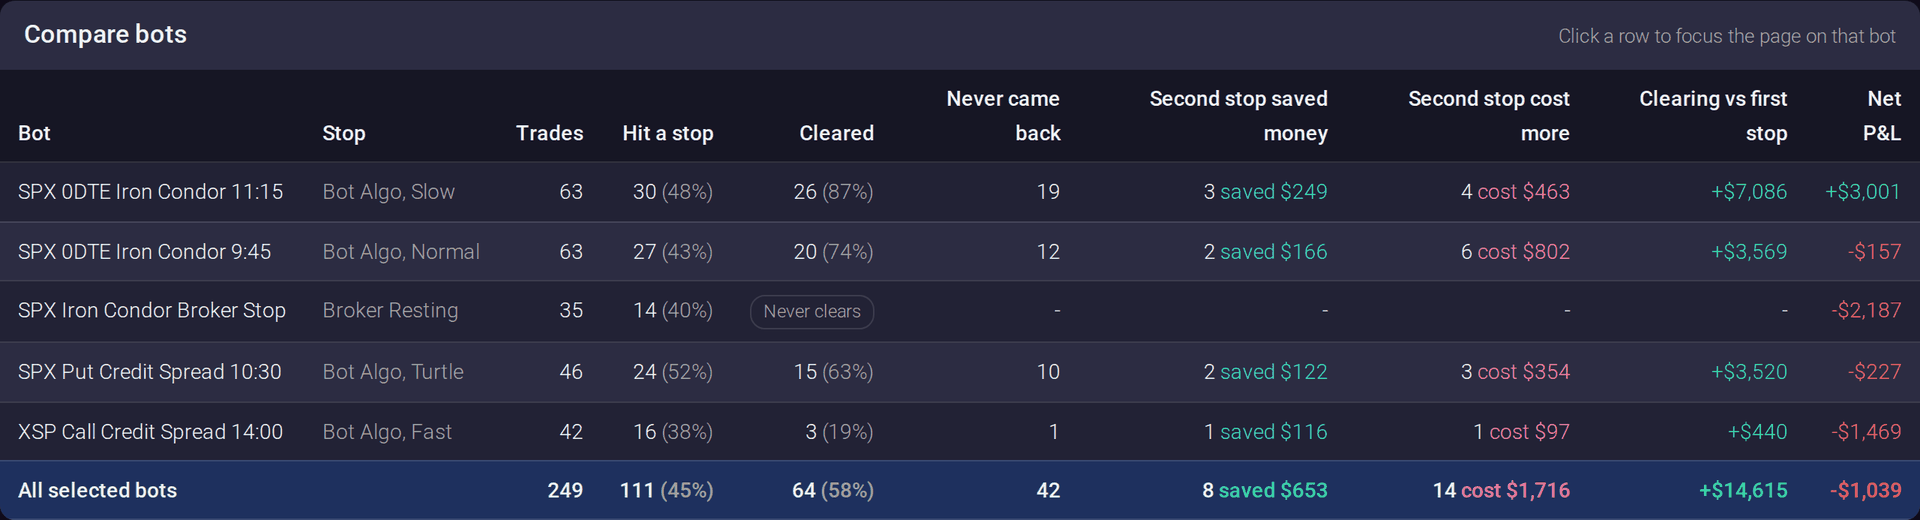
The Compare bots table has one row for each bot, beside the bot's current stop setting, such as Bot Algo with a speed, or Broker Resting. It shows trades, stop hits, cleared stops, how many never came back, how the second stops did, the clearing result against the first stop, and net P&L. A bot whose stop closes on the first hit shows Never clears.
Click a bot's row to focus every section on that bot. Click the All selected bots row to go back to the whole selection.
Cleared stops
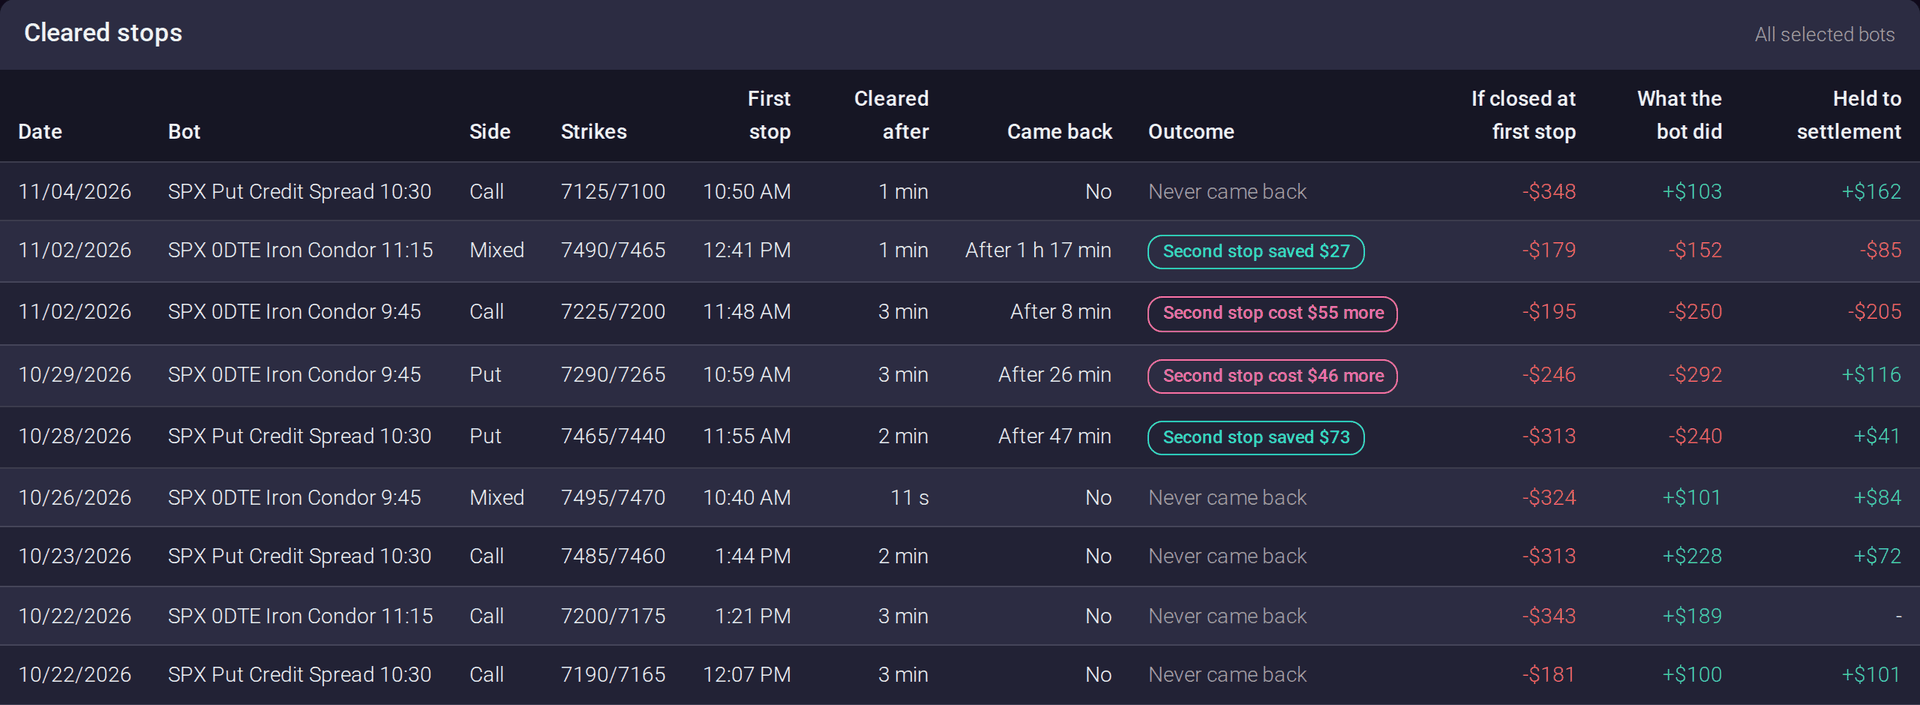
The last table lists every cleared stop, newest trade first, 25 to a page. Each row shows the date, bot, side, strikes, when the stop first hit, how long it took to clear, whether the trade came back, the outcome, and the three dollar figures from the worth table. Use Previous and Next to page through them.
What the report leaves out
- Trades that are still open or still holding a leg.
- Trades opened before stop history starts. The report shows that date.
- Trailing stops and bot dependency stops. They are not counted as stop hits.
- Broker Resting stops and the PDQ and Lightning stop speeds. They close on the first hit, so trades using them never clear.
- Trades a dollar comparison could not price. Each comparison uses only the trades it could price.
An iron condor follows its first stop hit. If the put side cleared and the call side stopped later, the trade counts as cleared and never came back, and its net P&L includes both sides.